Tableau Directional Vector Map
Directional Vector Map in Tableau
Directional maps help to show the trade routes, shipping and a whole host of directional data represented. The best way to represent this is by using the map in Tableau. Your boss may ask you to visually represent the amount of items shipped to different locations around the globe. We are going to pre-process the data to represent the origins and destinations.
Pre-requisites:
You will need to set up your data with a geographical variable for origins and destination, shipping amounts.
Data Format Summary:
To create a map chart in Tableau, the most common geographic field that user needs to have in data is “Country” field. This “Country” field is required to plot countries in the Tableau map.
Now, for the vector map in Tableau, apart from having the “Country” field in data, we need to have another field which is required to separate each line between corresponding countries. “PathID” in the attached data refer to this same field.
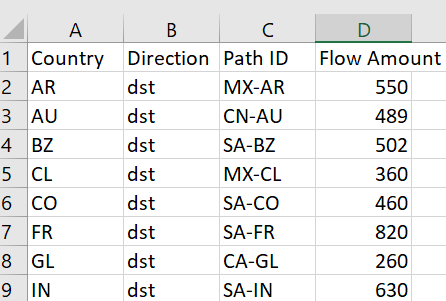
Following are the brief description of the format of the data and the fields that are being required to build vector map chart in Tableau
- Country: This is the mandatory field which lists every single country that user would like to plot on the map
- Direction: This field provides an extra information related to trade origin country (represented by ‘org’ in data) and trade destination country (represented by ‘dst’ in data)
- Path ID: This is also the mandatory field. We need this field to separate each vector line, to show a relationship between two trade countries
- Flow Amount: This field represents the magnitude of the amount of trade between two countries

Steps:
Following are the steps:
- Connect to the data source. For reference, purpose data is a csv pictured in the above image we are using the dataset.
- Go to Sheet1:
- In the “Measures” section double-click on the “Latitude (generated)” and “Longitude (generated)” fields
- Drag “Country” field to “Detail” of “Marks” card

- In “Marks” card, change the type of chart from “Automatic” to “Line”


- Drag “Path ID” field to “Color” of “Marks” card

- Drag “Flow Amount” measure in “Size” of “Marks” card. This is to change the thickness of the lines in the map chart. The thicker line between countries suggests that the amount of trade happening between those countries is higher.


Could you please share original data for this?