Python Machine Learning in Power BI
We are going to do some machine learning in Python to transform our dataset into algorithm-digestible data for churn analysis. using sci-kit learn It’s a ton easier than it sounds. We will be utilizing the Python scripting option within the query editor in Power BI. Learn more machine learning and Power BI use cases with EnterpriseDNA.![]()
There are typical stages of machine learning. These steps can be done all within the query editor in Power BI
- Preprocessing
- Model Training
- Predictions
Churn Predictions with Sci-Kit Learn’s Logistic Regression
The first thing you should do is make a duplicate of your existing dataset. We will be using logistic regression to classify users who have left the company. This churn is the value that we are trying to predict. We will use all the existing columns as features for our machine-learning model to evaluate. Churn Power BI PBIX notebook
Watch the Video Instructions
Features in our data that contribute to someone leaving the company
- satisfaction level
- evaluations
- promotions
- number of projects,
- time at the company
- department
- accident history
- promotions
Our Goal
Create a machine learning model that evaluates the features above and provides a new column of ‘predictions’ and ‘probability of leaving’ to our existing tables.
Our Data
Our data is a mix of categories and numbers which means that we will encode this data to be presented only as numbers for our machine-learning model to understand. We can use the sci-kit preprocessing library to change our data. The data has a ‘left’ column, this is what we will predict.

Use the Python Script
These packages will allow us to change the data into numeric and scaled formats. So that we are able to get a more accurate prediction. Additionally, we will split the dataset into training and test sets.
Avoid Integration Errors in Power BI
You can follow the instructions here to ensure that you don’t have issues. The written tutorial is here Avoid Power BI Integration Issues
Or Check out the Video:
- Open Power BI
- Load the dataset, in this example, we will import a CSV called HR_comma_sep
- Click the Transform heading and then choose Python Script.

Load the Python script window. This is where you will be entering the code. However, I highly encourage to use a IDE when writing your code to ensure the code works, Then copy and paste it into Power BI script editor.

The dataset is a variable that holds the table that you are running the script on. In the Python script using a hashtag is a form of notation to tell the reader what’s going on with your code.
Lets load in the Python dependencies:
import pandas as pd
import numpy as np
from sklearn.preprocessing import LabelEncoder, StandardScaler
from sklearn.model_selection import train_test_split
from sklearn.linear_model import LogisticRegression
Chose your target predictor and features for machine learning:
y = dataset['left']

features = ['satisfaction_level', 'last_evaluation', 'number_project',
'average_montly_hours', 'time_spend_company', 'Work_accident',
'promotion_last_5years', 'Departments ', 'salary']

X=dataset[features]
In machine learning, features are what describes your data aka dependent variable and target is what we are trying to predict. In this example, I have saved each feature I want to use in my model in a variable called features.
Encode your categories into numbers:
le = LabelEncoder()
df['salary'] = le.fit_transform(df['salary'])
df['Departments'] = le.fit_transform(df['Departments'])
Split the Data and Train the Model:
X_train,X_test,y_train,y_test = train_test_split(X,y)
Use the Logistic Regression Model Prediction
log = LogisticRegression()
log.fit(X_train,y_train)
Add the columns back to the dataframe(table)
dataset['predictions'] = y_pred
dataset['probability of leaving'] = y_prob[:,1]
The Full Code(Copy and Paste)–Bringing it All Together!
#Load in the dependencies
import pandas as pd
import numpy as np
from sklearn.model_selection import train_test_split
from sklearn.linear_model import LogisticRegression
from sklearn.preprocessing import LabelEncoder, StandardScaler


#lets change categories to numbers
le = LabelEncoder()
dataset['Departments'] = le.fit_transform(dataset['Departments'])
dataset['salary'] = le.fit_transform(dataset['salary'])
#preprocess your data
y=dataset['left']
features = ['satisfaction_level', 'last_evaluation', 'number_project',
'average_montly_hours', 'time_spend_company', 'Work_accident',
'promotion_last_5years', 'Departments', 'salary']
X=dataset[features]
#lets scale the data
s = StandardScaler()
X = s.fit_transform(X)

#split and train the dataset
X_train,X_test,y_train,y_test = train_test_split(X,y)

#Let the model predict results
log = LogisticRegression()
log.fit(X_train,y_train)
y_pred = log.predict(X)
y_prob = log.predict_proba(X)

# Lets add the columns back to the dataframe
dataset['predictions'] = y_pred
dataset['probability of leaving'] = y_prob[:,1]
Code Added to your Script Box


Once everything is complete you will be left with a result new table which will show the modified results made to your original table. This will be saved as a new query called dataset.
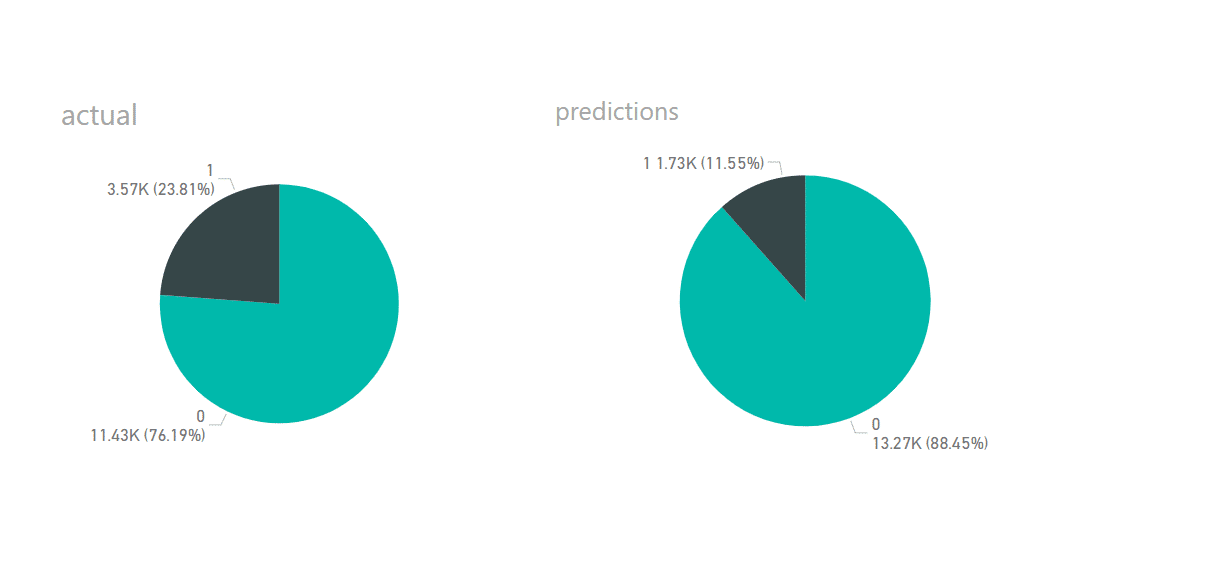
Click on the table to get the result changes which would be our two additional tables added ‘Prediction’ and ‘Probability of Leaving’. We can use these tables to judge the accuracy of our model.

User Power BI to visualize the model performance by comparing actual churn to your model’s performance. You improve the model’s performance through tuning or using other algorithms such as gradient boosting or cat boosting algorithms. Also, you can change the thresholds.

Powerbi error: ValueError: could not convert string to float: ‘s’
Where are you seeing this error?
Before ‘X=dataset[features]’
You need to apply this line to all of your string type feature (I added the “.astype(str)” as well):
df[‘feature1’] = le.fit_transform(df[‘feature1’].astype(str))
df[‘feature2’] = le.fit_transform(df[‘feature2’].astype(str))
Also get rid of null values (Do a replace of null with “NA” or something
Great addition. You can also do some of the data types transforms with the normal Power BI transformation.
And what about a prediction on new data. You predict targets on train data/ But it isn’t usefull
And what about using model for making a predictions on new data. In this example you predict targets on data which you use for training your model
Now that there is a trained model, new data can be added for predicted.
What changes would I make where the predict column is either 0, 1 or incomplete?
For example, if I have a dataset of jobs, some are complete and either passed or fail, but some are still incomplete. I want to be able to predict the probability of success of incomplete jobs based on a model trained on complete jobs.
Is that possible using this method?
Thanks
Essentially would be using the complete or not complete as your target variable. It would be using all other features that are associated with whether a user completes or not completes as your predictors. So yes it is definitely possible to predict more than a simple yes or no. This would be muliticlassification. You can use the OneVersustheRest Classifier in Sklearn.
in the last visualisation how did u seperate the same column values in the pie chart?
IN THE last visualisation how did u separate the same column value(yes/no’s) in the pie chart