Fatal Attacks by Dog Breed
How I made this Viz
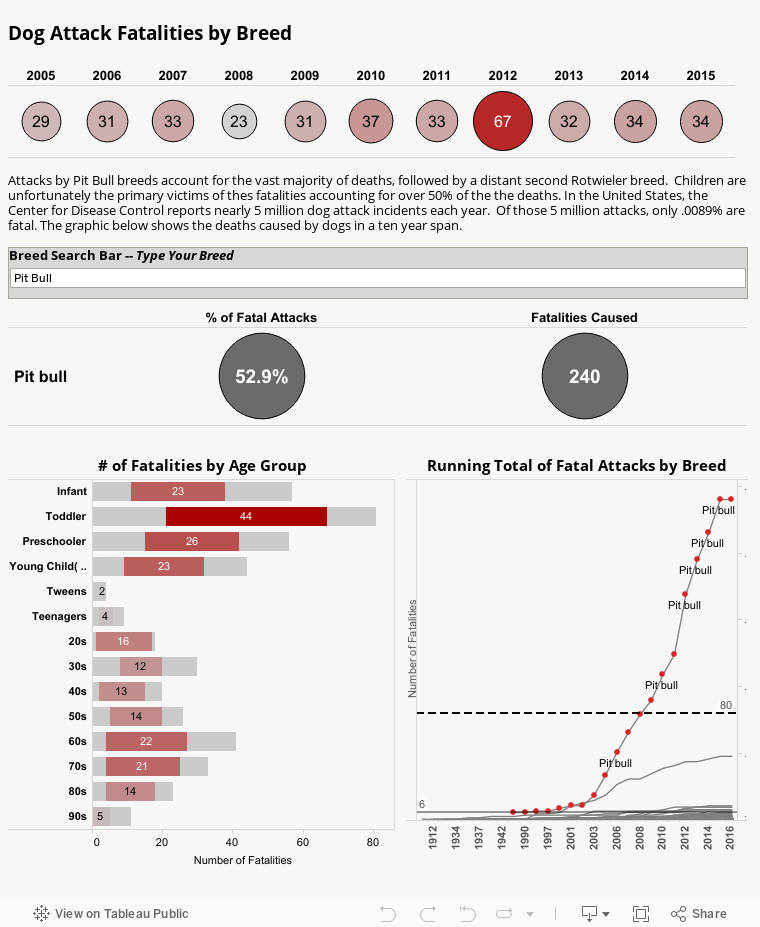
The data was taken from Wikipedia using the Power Query in excel. Once the data was imported, it was manipulated in excel. The viz contains two major sheets created in Tableau. The age group worksheet was made by using the SUM of number of records and the age of victims. However, these age was then grouped into similar a range from infants to 90s. The age group were placed in the dimension shelf and the number of records were placed in the measure shelf. This created a bar graph viz.
A Parameter was created called Choose a Breed. It used all the breed names as string. This parameter was linked to a case calculation that dictated when the breed parameter was used it displayed the number of records. Number of records was then used on the color shelf.
The Breed trend was created using the Date dimension specifying year for the dimension shelf while number of records and the case calculation where placed on the measure shelf. A line graph was chosen for the viz. The case calculation graphic was shapes. When the parameter used to selected a breed the shapes would overlay the breed selection. The breed dimension was used to separate the line graph.
Other Viz to View
Mario v Zelda Sales: Interactive Dashboard
Hip Hop Deaths: Why 2015 Was a Bad Year